


![Anti-HNRNPA0 antibody [EP16085] 40µl](https://yunshiji.oss-cn-shenzhen.aliyuncs.com/202407/25/hjr5ozoqdqo.jpg)
![Anti-HNRNPA0 antibody [EP16085] 100µl](https://yunshiji.oss-cn-shenzhen.aliyuncs.com/202407/25/51nbi3wktjb.jpg)
![Anti-H6PD antibody [EPR12338(B)] 100µl](https://yunshiji.oss-cn-shenzhen.aliyuncs.com/202407/25/5lc2tzqtskc.JPG)
![Anti-H Cadherin antibody [EPR9621] 10µl](https://yunshiji.oss-cn-shenzhen.aliyuncs.com/202407/25/t45zfrnrndd.jpg)
![Anti-H Cadherin antibody [EPR9621] 40µl](https://yunshiji.oss-cn-shenzhen.aliyuncs.com/202407/25/r15as0btm42.jpg)
![Anti-H Cadherin antibody [EPR9621] 100µl](https://yunshiji.oss-cn-shenzhen.aliyuncs.com/202407/25/j1zaesi3sad.jpg)
详细说明
概述
产品名称Anti-Histone H3 (mono methyl R128)抗体[EPR17898]
描述
兔单克隆抗体[EPR17898] to Histone H3 (mono methyl R128)
经测试应用WB
种属反应性
与反应: Mouse, Human
免疫原
Synthetic peptide (the amino acid sequence is considered to be commercially sensitive) within Human Histone H3 aa 100 to the C-terminus (mono methyl R128) (Cysteine residue). The exact sequence is proprietary.
Database link: P68431阳性对照
HeLa and NIH/3T3 whole cell lysates.
常规说明
This product is a recombinant rabbit monoclonal antibody.
Produced using Abcam’s RabMAb® technology. RabMAb® technology is covered by the following U.S. Patents, No. 5,675,063 and/or 7,429,487.
性能
形式Liquid
存放说明Shipped at 4°C. Store at +4°C short term (1-2 weeks). Upon delivery aliquot. Store at -20°C long term. Avoid freeze / thaw cycle.
存储溶液Preservative: 0.01% Sodium azide
Constituents: 59% PBS, 40% Glycerol, 0.05% BSA纯度Protein A purified
克隆单克隆
克隆编号EPR17898
同种型IgG
研究领域
Epigenetics and Nuclear Signaling
Histones
H3
Methylated
Anti-Histone H3 (mono methyl R128) antibody [EPR17898] 图像
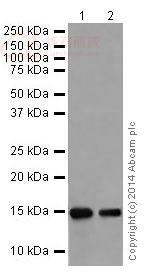
![Western blot - Anti-Histone H3 (mono methyl R128) antibody [EPR17898] (ab177301)](http://img.lianshimall.com/statics/attachment/goods/pl20160426/abcamMainImgPrimary/detail/ab17/ab1773013T3.jpg)
Western blot - Anti-Histone H3 (mono methyl R128) antibody [EPR17898] (ab177301)
All lanes : Anti-Histone H3 (mono methyl R128) antibody [EPR17898] (ab177301) at 1/1000 dilution
Lane 1 : HeLa (Human epithelial cells from cervix adenocarcinoma) whole cell lysate
Lane 2 : NIH/3T3 (Mouse embyro fibroblast cells) whole cell lysate
Lysates/proteins at 10 µg per lane.
Secondary
Goat Anti-Rabbit IgG, (H+L), Peroxidase conjugated at 1/1000 dilution
Predicted band size : 15 kDa
Observed band size : 15 kDa
Exposure time : 15 secondsBlocking buffer: 5% NFDM/TBST.
Dilution buffer: 1%BSA /TBST.
![Peptide Array - Anti-Histone H3 (mono methyl R128) antibody [EPR17898] (ab177301)](http://img.lianshimall.com/statics/attachment/goods/pl20160426/abcamMainImgPrimary/detail/ab17/ab177301ray.jpg)
Peptide Array - Anti-Histone H3 (mono methyl R128) antibody [EPR17898] (ab177301)
All batches of ab177301 are tested in Peptide Array against 501 different modified and unmodified histone peptides; each peptide is printed on the array at six concentrations (each in triplicate).
Circle area represents affinity between the antibody and a peptide: all antigen-containing peptides are displayed as red circles, all other peptides as blue circles. The affinity is calculated as area under curve when antibody binding values are plotted against the corresponding peptide concentration. Each circle area is normalized to the peptide with the strongest affinity.
The complete dataset, including full list of all peptides and information on the position of each peptide in the diagram, can be downloaded here.
 粤公网安备44196802000105号